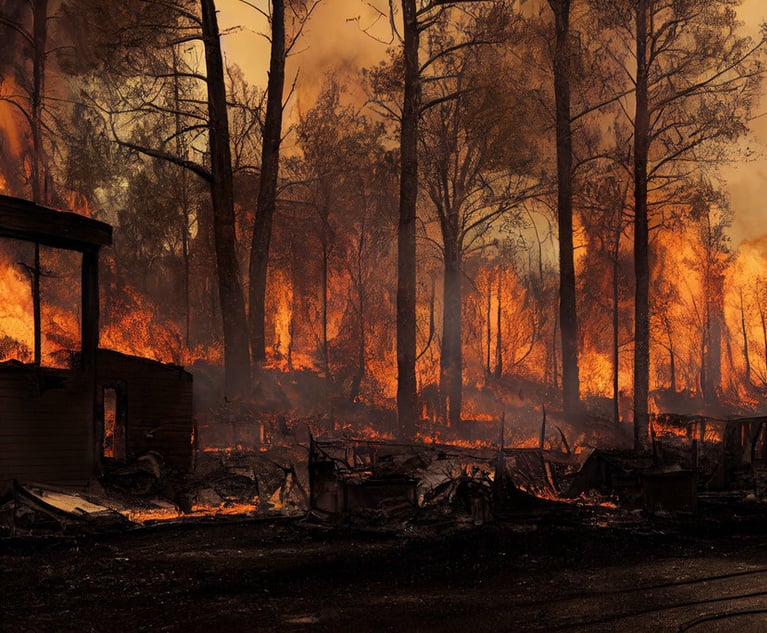
 The insurance industry is continually developing and updating hazard zones and loss simulation models to improve risk assessment, but we are probably still in a reactive phase when it comes to wildfire trends. (Credit: Jonatan/Adobe Stock)
Recommended For You
Want to continue reading?
Become a Free PropertyCasualty360 Digital Reader
Your access to unlimited PropertyCasualty360 content isn’t changing.
Once you are an ALM digital member, you’ll receive:
- Breaking insurance news and analysis, on-site and via our newsletters and custom alerts
- Weekly Insurance Speak podcast featuring exclusive interviews with industry leaders
- Educational webcasts, white papers, and ebooks from industry thought leaders
- Critical converage of the employee benefits and financial advisory markets on our other ALM sites, BenefitsPRO and ThinkAdvisor
Already have an account? Sign In Now
© Touchpoint Markets, All Rights Reserved. Request academic re-use from www.copyright.com. All other uses, submit a request to [email protected]. For more inforrmation visit Asset & Logo Licensing.


