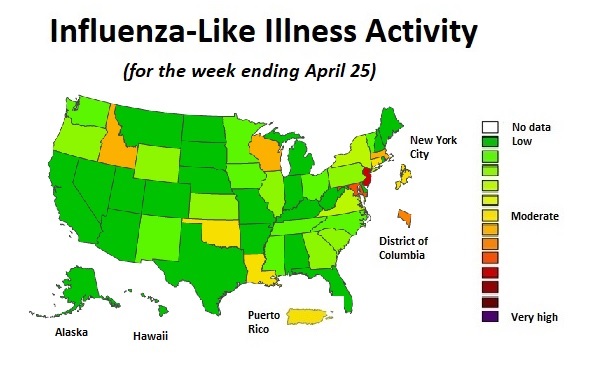
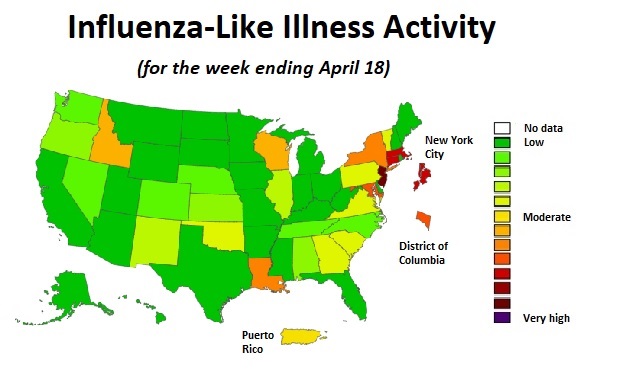
The latest government COVID-19 tracking report shows that outbreak activity appears to be falling in most of the country, but that activity may be starting to creep back up in some states.
The number of patients seeking care for the disease from primary care offices, urgent care centers, and hospital emergency rooms has fallen to a low level in most of the country.
But the number of patients seeking outpatient care for COVID-19 moved up some in Iowa, Minnesota, Mississippi, Oklahoma and Wyoming.
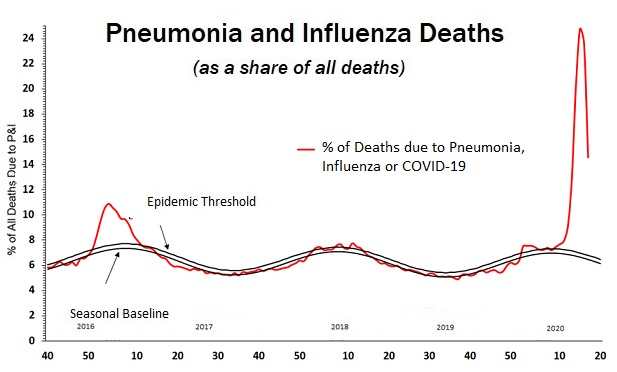
One sign of how rapidly COVID-19 was spreading a few weeks ago is that, in the week ending April 25, about 18% of all U.S. deaths were caused by COVID-19, or by something that looked an awful lot like COVID-19. That’s down from 25% for the weeks ending April 11 and April 18. But, in a normal week, fewer than 6% of deaths are caused by pneumonia or a flu-like illness.
Tracking U.S. COVID-19 cases
The U.S. Centers for Disease Control and Prevention (CDC) began publishing the weekly COVID-19 tracking reports on April 3.
Confirming COVID-19 cases with lab tests is still difficult and expensive, and many mild COVID-19 cases look like colds, flu or stomach bugs.
To make up for the problems with COVID-19 testing, the weekly COVID-19 tracking reports give outpatient visit numbers, hospitalization numbers and death numbers for pneumonia, influenza and “influenza-like illnesses” as well as for laboratory-confirmed cases of COVID-19.
Public health authorities define an “influenza-like illness” as a patient who has a fever over 100 degrees, along with either a cough or a sore throat.
The CDC depends on states to collect and report the data, and it notes that the data for the latest few weeks may be especially incomplete.
The new report shows that the total number of U.S. deaths was a little below average from Feb. 1 through March 21, but that the total number of deaths might have started to rise significantly above the expected level during the week ending April 4.
CDC calculates the “expected” death level figures by looking at the weekly death figures for the previous three-year period. The expected death total for a given week is the average number of deaths the CDC has recorded for the comparable week in the year over the previous three-year period.
Latest CDC numbers
The latest figures show that the total number of U.S. deaths from all causes increased to about 20% over the expected level in the week ending April 11, and about 15% over the expected level during the week ending April 18.
State-level figures for April 25 appear to be incomplete. State-level figures for the week ending April 18, which look somewhat more complete, and including New York City, show that the number of deaths in New York City was more than twice as high as the usual level.
The total number of deaths from all causes was also high in New York state as a whole, in New Jersey, and in Massachusetts.
For the country as a whole, for the entire period from Jan. 25 through April 18, the CDC has reports of a total of 692,949 deaths, compared with an expected total of about 686,000. For that period, for the whole country, the number of deaths the CDC has recorded is about 1% higher than the expected level.
Deaths by Week |
||||||
| Ending Date | COVID-19 Deaths | Pneumonia Deaths | FLU Deaths | Pneumonia, FLU and COVID Deaths | Total Deaths | Percent of Expected Deaths |
|---|---|---|---|---|---|---|
| Feb. 1 | - | 3,688 | 469 | 4,157 | 57,266 | 97 |
| Feb. 8 | 1 | 3,672 | 494 | 4,167 | 57,615 | 97 |
| Feb. 15 | - | 3,693 | 517 | 4,210 | 56,878 | 97 |
| Feb. 22 | - | 3,557 | 536 | 4,093 | 56,806 | 98 |
| Feb. 29 | 5 | 3,626 | 619 | 4,247 | 56,843 | 99 |
| March 7 | 25 | 3,719 | 583 | 4,312 | 56,212 | 97 |
| March 14 | 49 | 3,676 | 578 | 4,277 | 53,968 | 95 |
| March 21 | 493 | 4,150 | 496 | 4,907 | 53,979 | 95 |
| March 28 | 2,712 | 5,624 | 410 | 7,463 | 57,430 | 103 |
| April 4 | 8,082 | 8,724 | 432 | 13,148 | 64,313 | 115 |
| April 11 | 12,262 | 9,841 | 430 | 16,744 | 66,577 | 120 |
| April 18 | 10,408 | 7,606 | 215 | 13,663 | 55,062 | 101 |
| April 25 | 3,271 | 2,806 | 67 | 4,777 | 26,489 | 49 |
.
Deaths by State* (Week ending April 18) |
||||
State |
COVID Deaths |
Pneumonia Deaths |
Total Deaths |
Percent of Expected Deaths |
|---|---|---|---|---|
| Alabama | 39 | 60 | 740 | 96% |
| Arizona | 41 | 74 | 1,013 | 106% |
| California | 362 | 573 | 5,063 | 102% |
| Colorado | 147 | 132 | 932 | 109% |
| Delaware | 18 | 10 | 111 | 90% |
| District of Columbia | 17 | 23 | 96 | 98% |
| Florida | 157 | 309 | 3,651 | 102% |
| Georgia | 71 | 86 | 1,049 | 96% |
| Illinois | 408 | 385 | 2,482 | 108% |
| Indiana | 147 | 147 | 1,069 | 101% |
| Iowa | 26 | 34 | 523 | 98% |
| Kansas | 27 | 30 | 470 | 97% |
| Kentucky | 35 | 51 | 579 | 91% |
| Louisiana | 171 | 114 | 718 | 103% |
| Maryland | 250 | 181 | 1,185 | 106% |
| Massachusetts | 855 | 408 | 2,139 | 114% |
| Michigan | 490 | 373 | 2,285 | 110% |
| Minnesota | 61 | 82 | 831 | 102% |
| Mississippi | 48 | 74 | 627 | 102% |
| Missouri | 50 | 66 | 923 | 94% |
| Nevada | 23 | 29 | 405 | 100% |
| New Hampshire | 15 | 16 | 238 | 101% |
| New Jersey | 1,571 | 970 | 3,619 | 135% |
| New Mexico | 11 | 17 | 226 | 91% |
| New York | 1,510 | 1,003 | 3,830 | 124% |
| New York City | 2,772 | 1,082 | 4,595 | 224% |
| North Carolina | 0 | 0 | 0 | 47% |
| Ohio | 23 | 74 | 1,306 | 89% |
| Oklahoma | 21 | 27 | 437 | 88% |
| Oregon | 19 | 19 | 406 | 94% |
| Pennsylvania | 556 | 359 | 2,917 | 82% |
| Rhode Island | 17 | 10 | 76 | 88% |
| South Carolina | 35 | 64 | 904 | 106% |
| Tennessee | 21 | 85 | 1,255 | 100% |
| Texas | 113 | 268 | 2,995 | 99% |
| Virginia | 141 | 105 | 1,301 | 103% |
| Washington | 41 | 63 | 765 | 100% |
| Wisconsin | 48 | 47 | 909 | 104% |
| Puerto Rico | 13 | 25 | 257 | 69% |
| UNITED STATES | 10,408 | 7,606 | 55,062 | 101% |
| * This table leaves out states that had missing COVID-19 or pneumonia death data. | ||||
See also:


 Home
Home


 Copyright © 2025 ALM Global, LLC. All Rights Reserved.