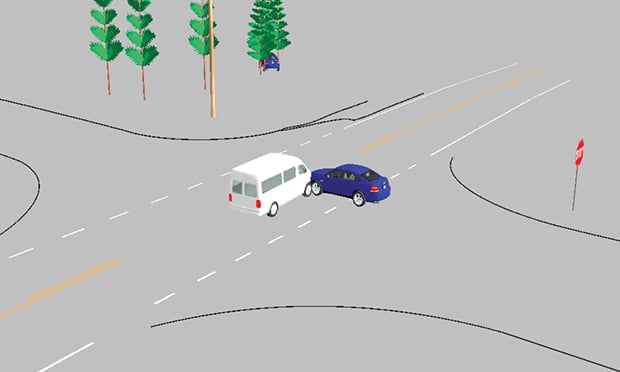
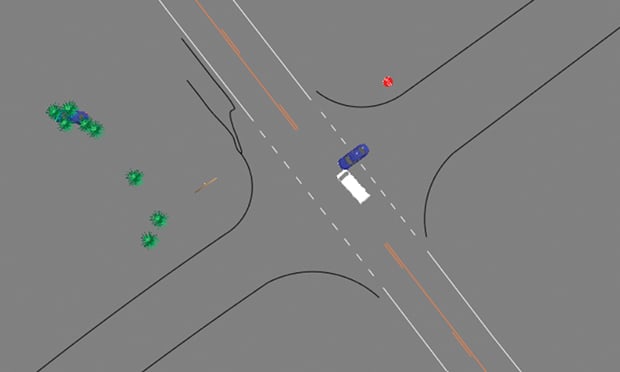
 While photographs show what happened following an accident, a diagram can show pre-collision movement. (Photo: The Warren Group)
When it comes to diagramming a crash scene, there are several methods to complete the task. Forensic mapping, (locating, positioning and documenting the evidence of a collision scene to scale) is essential to having the answers to the questions, "who, what, where, when and why." Photographs do a great job of showing what the investigators saw post-collision, yet they lack scale and the ability to describe pre-collision movement. Having a computer-aided diagram (CAD) of the collision scene goes much further than pictures can; here is why.
 Figure 1. (Photo: The Warren Group)
Recommended For You
Want to continue reading?
Become a Free PropertyCasualty360 Digital Reader
Your access to unlimited PropertyCasualty360 content isn’t changing.
Once you are an ALM digital member, you’ll receive:
- Breaking insurance news and analysis, on-site and via our newsletters and custom alerts
- Weekly Insurance Speak podcast featuring exclusive interviews with industry leaders
- Educational webcasts, white papers, and ebooks from industry thought leaders
- Critical converage of the employee benefits and financial advisory markets on our other ALM sites, BenefitsPRO and ThinkAdvisor
Already have an account? Sign In Now
© 2025 ALM Global, LLC, All Rights Reserved. Request academic re-use from www.copyright.com. All other uses, submit a request to [email protected]. For more information visit Asset & Logo Licensing.


