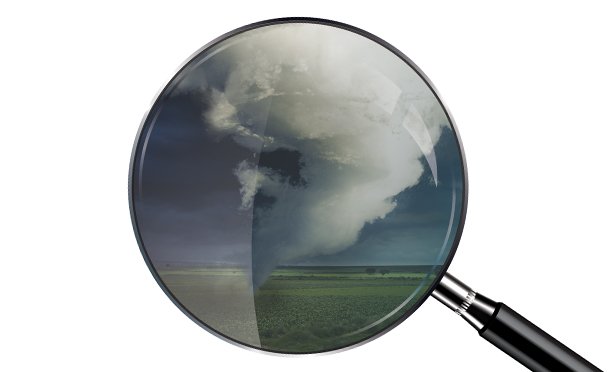
Weather CSI: Verifying the impact of wind, rain & storm surge
Like the crime scene investigators on popular television shows, insurers are using forensic meteorology to verify the real source of hurricane-related claims.
It’s no surprise that 2017 was a record-setting year for global insured (and un-insured) losses due to natural disasters, driven in no small part by the costliest hurricane season in U.S. history. Although assessing hurricane-related claims may seem fairly straightforward to those unfamiliar with the process – a building was either hit or it wasn’t – meteorologists and experienced claims adjusters know that often isn’t the case. This is especially true as one moves farther from the eye of the storm and the most extreme and obvious impacts.
With these more ambiguous claims, forensic meteorology offers valuable insight, often reconstructing conditions at a loss location to identify and quantify hurricane-related hazards.
Almost without exception, damage due to tropical cyclones (hurricanes and tropical storms) is attributed to high winds, extreme rainfall or storm surge. The magnitude of these impacts at any given location depends on numerous factors beyond the closest approach of the eye of the storm. Failure to understand and account for these factors can lead to under- or over-estimation of impacts, and ultimately to poor coverage decisions.
The following discussion examines each major impact (wind, rain and storm surge), the data and analytical tools available to reconstruct conditions at a given location including tropical cyclone-related hazards. Many of the same analytical methods can be applied to other types of weather events, including severe thunderstorms.
Related: Flying high after catastrophes — drones provide critical ‘eyes’ to assess property damage
High winds
In the 45 years since the introduction of the Saffir-Simpson scale, hurricane wind speeds have become nearly synonymous with hurricane intensity and damage potential. While increasing winds do produce increasing damage, a storm’s maximum wind speed tells only part of the story of its destructive potential.
Two storms with similar maximum wind speeds can produce vastly different amounts of damage. The size of the storm (and the size of its wind field) as well as the forward speed of the storm greatly influence its destructive potential, as Category 3 hurricanes Ivan and Dennis demonstrated when they impacted the same stretch of the Gulf Coast just 10 months apart in 2004 and 2005. Despite similar maximum wind speeds, Ivan – a larger storm – produced seven and a half times more damage. In other words, size matters with hurricanes.
Straight-line winds
Winds within a hurricane – both sustained winds and gusts – are generally strongest in and near the eye wall, with wind speeds decreasing with distance from the center of the storm. The smaller the hurricane, the more quickly winds decrease with distance.
For example, despite its Category 5 intensity, Hurricane Andrew – a notoriously compact storm – had hurricane-force winds that extended outward only 30-45 miles. Hurricane Irma’s hurricane-force winds extended outward more than twice that distance.
Related: Understanding debris removal coverage, costs and settlements
Tornadoes
Tornadoes most often occur far from the center of a hurricane, in the outer bands of thunderstorms that sweep counterclockwise away from the eye. The vast majority of these tornadoes develop in the right-front quadrant of the storm, relative to its direction of motion. During Hurricane Irma, 23 tornadoes were identified across the state of Florida – all of them in areas impacted by the right-front quadrant of the storm – and all but four tornadoes occurred along the Atlantic coast of the state.
Tornadoes that form in association with hurricanes are generally short-lived and relatively weak. Although they tend to form near the coast, they can certainly occur further inland: during Hurricane Harvey, more than two-dozen tornadoes were reported in and around Houston, Texas. Some were nearly 80 miles inland.
Data
Straight-line wind speeds can be assessed through in-situ (weather station) observations, post-storm damage surveys and weather radar data. Each data source has its own advantages and disadvantages, so to obtain the most comprehensive and rigorous reconstruction of wind conditions, use all three data sources.
Weather station data provides on-the-ground observations (as long as they continue operating during the peak of the storm), while damage surveys assess the aftermath to determine the wind speeds necessary to produce the observed damage. In areas removed from weather stations or population centers, weather radar offers data on winds aloft that can be extrapolated to estimate winds near the surface.
The location and intensity of tornadoes are assessed through storm reports, damage surveys and radar data.
Related: What we’ve learned from Hurricanes Harvey, Maria and Irma
Extreme rainfall
As Hurricane Harvey demonstrated to devastating effect in August of last year, rainfall-induced flooding can be at least as destructive as extreme winds during tropical cyclones.
Although the more-than-four-feet of rain that Harvey squeezed out of the skies over Texas was truly unprecedented, most tropical cyclones produce prolonged, heavy rainfall that can lead to flooding both during and after the storm, often far inland of the landfall location.
Slower moving storms – which are often weaker in terms of maximum wind-speeds – tend to produce greater flooding, as do storms whose paths hug the coast, allowing the hurricane to continue feeding on warm ocean waters while simultaneously dumping its precipitation load over land. Hurricane Harvey was a near-perfect example of the destructive potential of a slow-moving, coast-hugging storm.
Related: Top 10 states for home claims due to hail
Data
In-situ rain gauge data provide measured rainfall totals at specific locations. In urban areas rain gauges may be only five to 10 miles apart, while in rural areas, they can be 50 or more miles apart. Radar data can fill in the gaps between rain gauges by providing rainfall estimates anywhere within the radar’s coverage area. To determine whether the radar estimates are accurate for a given event, compare in-situ measurements to the radar estimates at rain gauge locations.
Rain gauges and weather radar can indicate how much it rained but not whether that rainfall actually caused flooding. Storm reports and damage surveys provide this additional information. The National Weather Service collects storm reports for all tropical cyclones, and the U.S. Geological Survey conducts damage surveys for most major flooding events. For prolonged, widespread flooding events like Hurricane Harvey, satellite data can also reveal the impacted areas.
Storm surge
Along the coast, storm surge is the greatest threat to life and property. As with hurricane winds, the most severe storm surge typically accompanies the right-front quadrant of the hurricane, where the wind field and the storm’s forward motion act to push water onshore. Unlike hurricane winds which tend to be similar in nearby areas, storm surge can vary significantly even within the span of a few miles.
The reason for this variability is that storm surge is a complex phenomenon dependent on characteristics of both the hurricane and the local landscape. Among the local variables affecting storm surge are the width and slope of the continental shelf as well as the unique geometry of the coast.
Among the storm-related variables that impact storm surge are hurricane intensity, size and forward speed, as well as its angle of approach to the coastline. The slightest change to any one of these variables can significantly increase or decrease storm surge potential.
In addition to storm surge – formally defined as the abnormal rise of water generated by a storm – one must also consider the local astronomical tide. Storm surge rides atop the normal tidal flow, creating a combined “storm tide” that ultimately determines the depth and extent of inundation. A storm that strikes at high tide can result in inundation several feet deeper than if that same storm strikes at low tide.
A final factor that influences damage along the immediate coast is wave action, which can significantly increase the impact of storm tide. Often, the height of waves riding atop the storm tide can exceed the height of the storm tide itself. As a recent example, during Hurricane Irma wave wash marks in the lower Florida Keys were observed more than 10 feet above the storm tide.
Data
Ahead of a hurricane, the United States Geological Survey (USGS) typically deploys a network of temporary storm-tide sensors along the immediate coast in the projected path of the storm. These sensors record the depth of the storm tide throughout the event, and comparison of nearby sensors provides insight into the range of water levels experienced along a particular stretch of coastline.
In those areas not covered by the storm tide sensor network, the USGS often performs surveys of visible high-water marks in the immediate aftermath of the storm. High-water marks are created when small, light debris carried atop the water is deposited on vertical surfaces like walls and doorways; as with storm tide sensors, they provide data about the maximum water height at a given location.
The National Weather Service also performs post-storm damage surveys that include findings regarding storm surge, maximum inundation, and wave height.
Each of these factors plays a key role in determining the full impact of a storm on an area, the source of the damage and which aspects may be covered by insurance. While the damage may be obvious, the actual cause may take a little more investigation.
Megan D. Walker-Radtke, CCM (meganwr@blueskiesmeteorology.com) is the chief meteorologist with Blue Skies Meteorological Services in Gainesville, Fla.
For more information on the technology available to determine the impact of weather on property claims, plan to attend America’s Claims Event in Austin, Texas, from June 25-27.