While risk-retention groups (RRGs) saw premiums decline in 2010, RRG domiciles last year experienced marked overall growth—and for the first time ever, surplus surpassed total premiums. 

Premiums for the RRG industry in 2010 dropped 3.5 percent to $2.48 billion. But industry assets grew by 8 percent to $7.15 billion and industry surplus grew by 11.9 percent to $2.84 billion.
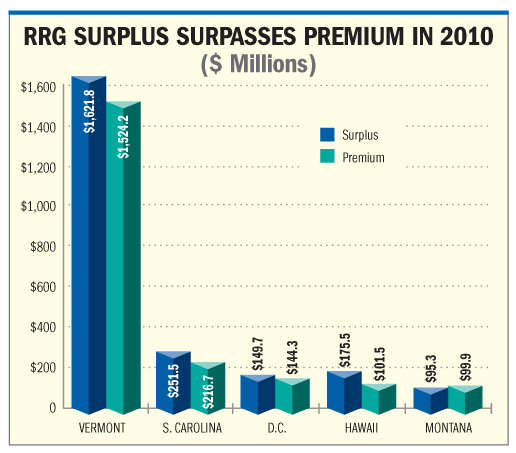
During the early part of the last decade, premiums, total assets and surplus all climbed exponentially. When the economy stalled, however, RRG premiums began to falter. But both assets and surplus continued to increase steadily, never seeing a decline.

Much of the reason there was no overall decline is due to the heavyweight RRGs (the top 15 or so), most of them with 20 years or more of doing business.

So even though they wrote less premium, they had the infrastructure to keep growing surplus and assets. Many of the smaller, younger groups did see a decline in surplus/assets when they saw a drop in premium, but they were so small that it didn't affect the industry totals. 

Premiums-to-surplus ratios are measures of insurer strength, with weaker, overleveraged companies reporting higher ratios. At .87, the RRG ratio is now more in line with the rest of the property and casualty industry, which reported a .76 ratio overall in 2010.

By comparison, premium in 2009 was $2.6 billion; and in 2008 was $2.57 billion.

Surplus in 2009 was $2.54 billion; and in 2008 was $2 billion.

Vermont

Among domiciles, Vermont once again dominated the market, with 31 percent of all RRGs domiciled in the state.

Premiums for the domicile, however, fell by more than 6 percent in 2010, due in part to declines in premiums of its two largest RRGs. Vermont RRGs also saw a 10.5 percent gain in surplus, which reached $1.6 billion; and a 9.7 percent gain in assets to $3.82 billion.

Much of the growth in assets and surplus was spurred by Vermont's healthcare sector—particularly in the physicians subsector, which grew by 18.2 percent.

While Vermont still accounts for the lion's share of RRGs—and therefore premiums, assets and surpluses—several other states are starting to increase their market share.

South Carolina

Long the No. 2 domicile in terms of number of RRGs, South Carolina bucked the trend and saw an increase in premium in 2010, as well as an increase in both total assets and in surplus.

South Carolina RRGs' premium rose by 7.6 percent to $216.7 million, with much of this growth fueled by RRGs serving physicians, with premiums jumping 12 percent for this sector.

Assets for South Carolina RRGs grew by 9.4 percent to $640.2 million and their surplus grew by 8.8 percent to $251.5 million.

Washington, D.C.

Ranked third in overall RRG premium is Washington, D.C. with $144.3 million, a decline of 1 percent from 2009.

In terms of total assets and surplus, D.C. showed mixed results. Total assets for RRGs in the domicile were down by 1.9 percent, while surplus saw a gain of 9.6 percent.

Accounting for nearly half of all RRG premium in the district are nursing-home RRGs. But the showing in 2010 wasn't enough to offset declines experienced in other business areas.

Hawaii

Fourth-ranked Hawaii saw a 2.1 percent decline in premium from 2009 to 2010 from $103.5 million to $101.5 million. However, the state had a huge 20 percent jump in surplus and a 6.8 percent increase in total assets.

Montana

Fifth-ranked Montana had a great year in 2010, with a 7.9 percent increase in premium to $99.9 million. The state also saw a staggering 22 percent increase in surplus and a 14 percent increase in total assets. 

Nevada

Nevada jumped from the eighth to the sixth spot of rankings by premium, with a 6.4 percent increase to $82.1 million. The state also saw assets increase by 4.3 percent to $179.8 million, but saw its surplus fall by 4.3 percent to $52.6 million.

Want to continue reading?
Become a Free PropertyCasualty360 Digital Reader

Your access to unlimited PropertyCasualty360 content isn’t changing.
Once you are an ALM digital member, you’ll receive:

  • Breaking insurance news and analysis, on-site and via our newsletters and custom alerts
  • Weekly Insurance Speak podcast featuring exclusive interviews with industry leaders
  • Educational webcasts, white papers, and ebooks from industry thought leaders
  • Critical converage of the employee benefits and financial advisory markets on our other ALM sites, BenefitsPRO and ThinkAdvisor
NOT FOR REPRINT

© 2025 ALM Global, LLC, All Rights Reserved. Request academic re-use from www.copyright.com. All other uses, submit a request to [email protected]. For more information visit Asset & Logo Licensing.